Not financial advice. Education only.
This is my personal opinion and what I'm doing with my own money, shared for educational purposes. It isn't a recommendation to buy, sell, or hold anything, and it isn't tailored to you. I may hold the securities mentioned. Hindsight makes everything look easy, and the market can fall further from here.
Written October 31, 2026, using prices as of the October 30 close (Yahoo Finance) and the news sources linked below. Markets move fast, so verify current numbers.
Quick answer
- QQQ closed at $690.49 on October 30, 9.1% below its October 6 record, after an AI-spending scare hit tech.
- QQQ has had four completed 10%+ pullbacks in the last three years and a fifth is in progress. Pullbacks are normal, even in a bull market.
- My opinion: cyclical, not structural. Earnings are still growing, and the fear is about the cost and payback of AI spending.
- I sold a few names (META, NOW and MSFT) to raise cash, though in hindsight about 20% cash would have helped more. I'm now deploying a little at a time, and I'd add more QQQ near $660.
It's been a rough week for tech. Alphabet lost about $500 billion in a day, Amazon and Intel added fuel on Friday, and the Nasdaq 100 came within a whisker of a 10% correction. My view is that this is a normal, expected pullback inside a bull market, not the start of a structural decline. Here's the evidence, how I think it could have been prepared for, and what I'm doing now.
What Happened in the Stock Market This Week?
The trigger was fear that AI spending is running ahead of the returns:
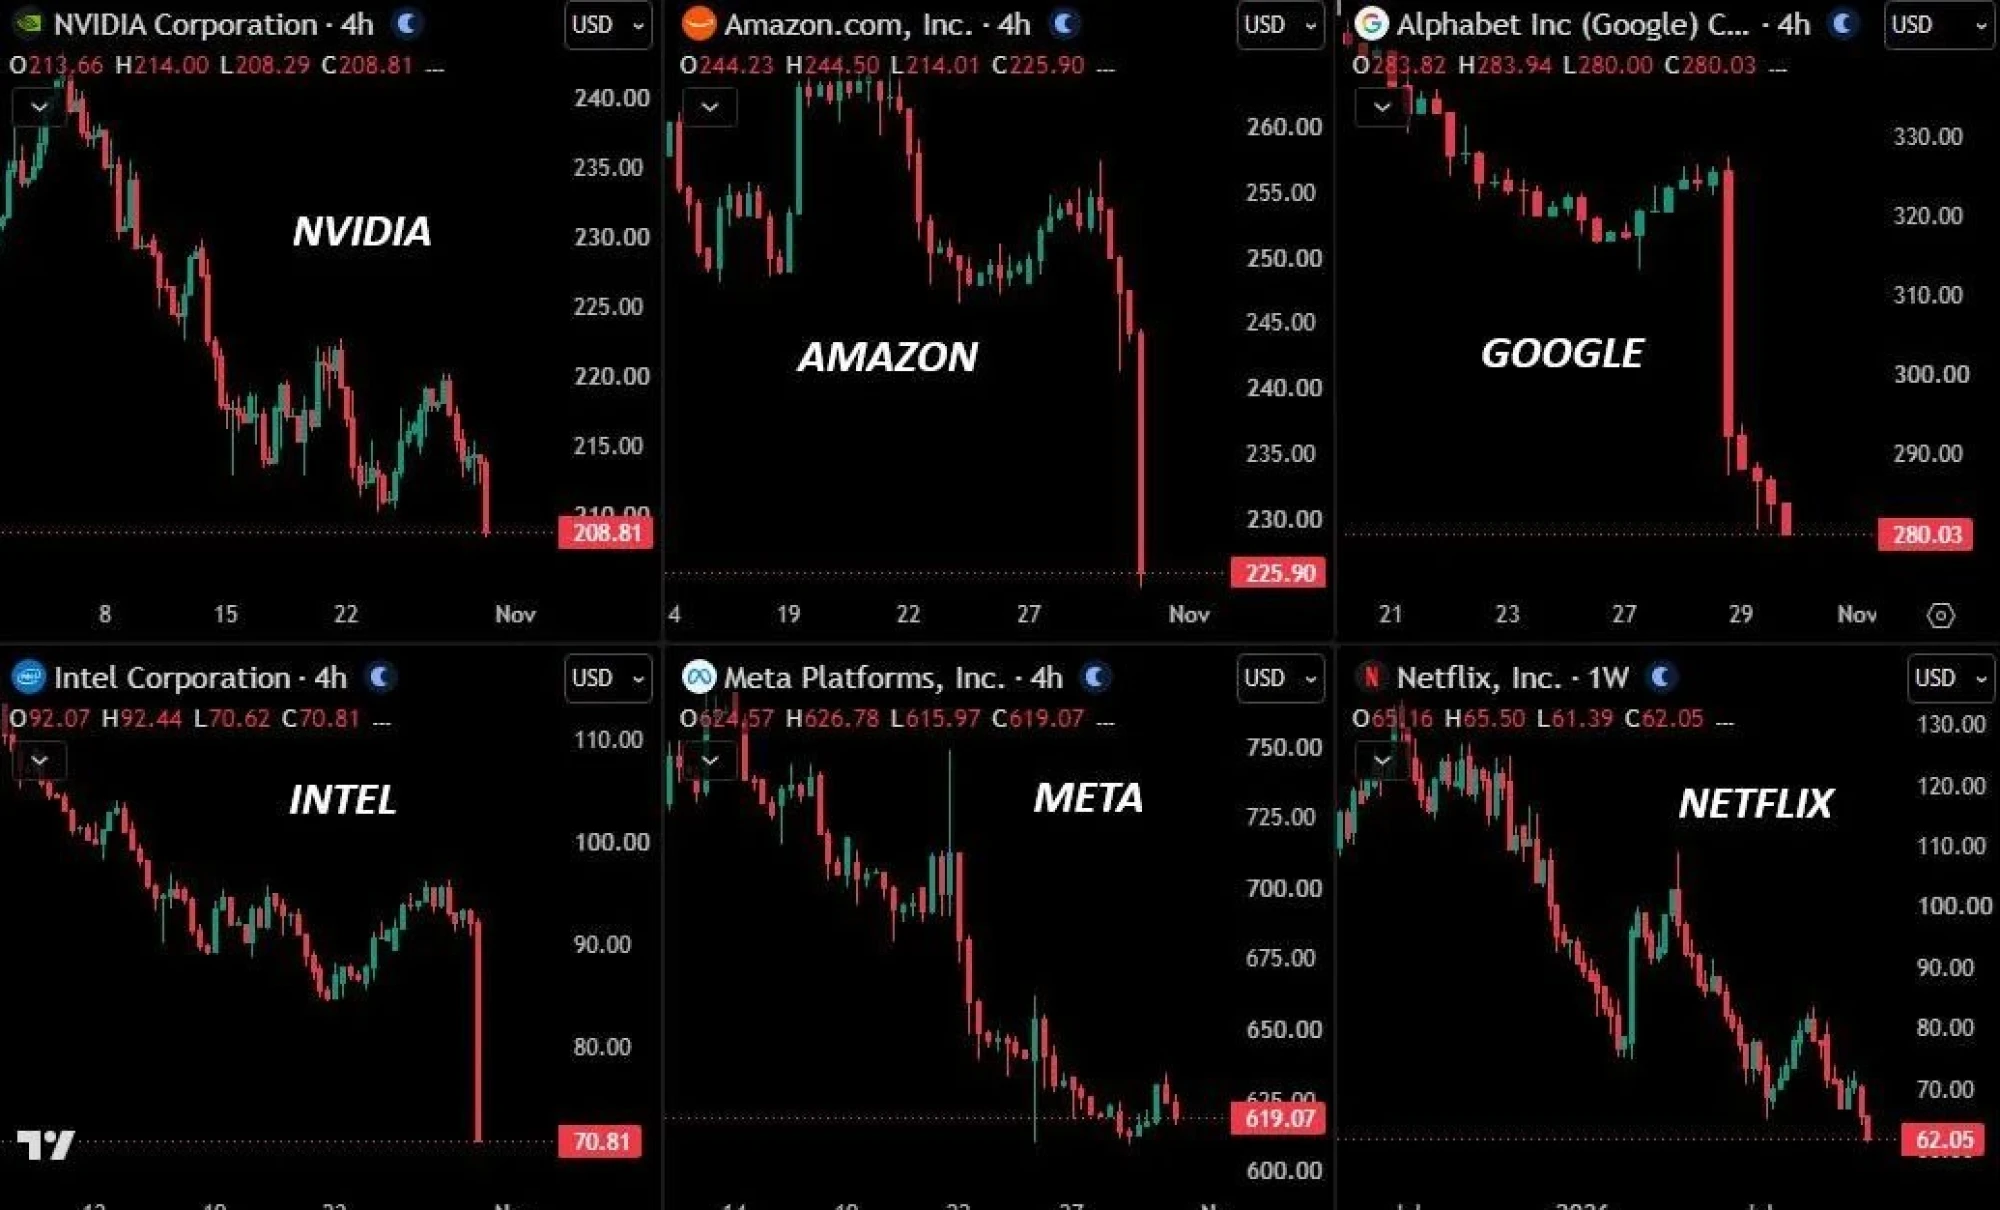
- Thursday, October 29: Alphabet fell about 12.6%, losing roughly $500 billion in value, its biggest one-day dollar loss ever, after reporting negative free cash flow and heavy capex. I wrote about that in why GOOGL fell 13% and how I think about it.
- Friday, October 30: Intel plunged about 29% on weak fourth-quarter guidance, its biggest one-day drop on record. Amazon said 2026 capex should be about $220 billion and would rise again in 2027; it fell as much as 10% after hours Thursday and closed down 1.4% Friday. The chip index dropped 7.2%. Tech lost more than $1 trillion in value, the Nasdaq Composite fell about 2.8%, and the Nasdaq 100 came close to correction territory (NBC News).
How Big Is the Nasdaq Pullback Right Now?
QQQ, the ETF tracking the Nasdaq 100, closed at $690.49 on Friday, down 3.5% on the day and 9.1% below its October 6 record close of $759.66. Intraday it touched roughly 10% down. That's right at the textbook line for a correction.
How Often Does QQQ Pull Back 10% or More?
Often, even in a bull market. Here are the 10%+ declines since mid-2023, from daily closing prices (my calculation, price only):
In the last three years that's four completed pullbacks of 10% or more, and a fifth in progress (six if you count the late-2023 one). And through all of it, QQQ is up about 97% in three years, from $350.87 on October 31, 2023 to $690.49 (price only). Stretch it back to 1999 and QQQ has had 19 declines of 10% or more. I covered that in QQQ at all-time highs: preparing for a 10–20% correction, written when QQQ was near its record.
Why I See This as a Cyclical Pullback, Not a Structural Decline
"Structural" would mean something is broken in the long-term story. "Cyclical" means a swing within an intact trend. Here's how I weigh it:
| What would make it structural | What I see now |
|---|---|
| Profits and revenue at the big AI companies shrinking | Still growing. Alphabet's revenue grew 25%, Cloud 103%, and operating income 30% |
| Cloud and AI demand rolling over | Cloud backlog at Alphabet is about $561B, and AI capex budgets are being raised, not cut |
| Credit or liquidity stress spreading | No broad credit stress in the coverage I found, but AI companies are borrowing more, so it's worth watching |
| Breadth: everything falling together | Mixed: Microsoft is only about 4% off its peak, while ServiceNow, chips, Alphabet and Meta fell 20–34% |
The honest counterpoint: the fear itself is about whether the AI boom pays for itself, and that is the structural bear case. If spending keeps rising faster than revenue and free cash flow stays negative, the market could keep marking these companies down. So I'm not claiming certainty. I'm saying the fundamentals haven't cracked yet, and the pullback looks like the many others QQQ has had.
Who got hit hardest?
The index fell about 9%, but individual names fell much more. That's the point of the next section.
ServiceNow (NOW): a time correction after a big run
ServiceNow is the biggest decliner on that chart after Intel, and it's one I sold. My view is that it's a time correction: the stock had run about 44% in roughly three months, from $110 on July 30 to a peak close of $158.96 on October 23 (and about 83% from its May low). It then fell about 27% in a single day on October 29, its worst day on record, and now sits near $105, below that July low. In other words, it gave back the entire run.
The trigger was its Q3 report: adjusted EPS of $1.00 versus $1.02 expected (its first miss in six quarters), a slower outlook for contract growth, and renewed fears that AI could disrupt software companies (CNBC). The business itself is still growing: revenue rose 20.5% to about $4.11 billion, and it raised an AI-related target even as slower contract growth overshadowed it (24/7 Wall St.). The close-to-close drop was about 27% (Trefis).
I should be honest about the counterargument. A one-day 27% drop on slower guidance looks more like a repricing than a gentle time correction, and "AI disrupts software" is a structural argument, not a cyclical one. That's why NOW isn't on my list of buys right now, even though I think the sell-off is overdone relative to the business.
Could This Have Been Prepared For?
I believe so, and I did part of it: I sold a few names, including META, NOW and MSFT. In hindsight, about 20% in cash would have made this far less painful, raised by trimming the names that had run the most: MSFT, META, AMZN, QQQ, GOOGL, SOXX and NOW. A pullback of this kind is normal enough that I think it's worth planning for before it happens, which is what I argued in my earlier QQQ post.
Two honest caveats, because hindsight is generous:
- Not every trim helps equally. Looking at the chart above, META and NOW, two of the ones I sold, are down about 21% and 34% from their recent peaks. MSFT, which I also sold, is only about 4% off its peak, so that sale has done the least for me so far.
- Cash has a cost. Over the last three years, QQQ rose about 97%. A portfolio that was 80% QQQ and 20% cash (earning nothing) would have gained about 77% over the same stretch, roughly 20 points less, in exchange for a softer ride in each pullback.
The trade-off is the whole point: cash is insurance, and insurance costs something. In return, a 15% fall in the market becomes about a 12% fall in the portfolio, and you have cash to buy with.
Why Not Netflix?
Netflix wasn't on my trim list, and I didn't sell it. I doubled down on it instead. My reasoning: NFLX had already been through its own reset before this week, with its Q3 report, a trimmed ad target and a bigger rival in Paramount-Warner Bros. Discovery (I broke that down in my Netflix post after Q3), so I judged that much of the bad news was already in the price and that it had less to lose than the AI leaders.
That's a judgment, not a guarantee. Netflix has fallen too: it closed at $62.08, about 25% below its September high and below its earlier 52-week low. It can fall further, which is exactly why it sits inside my sizing limits (up to about 5%) and not at the 10% ceiling.
What Am I Doing Now?
I've started deploying a little of the cash, in small pieces, into NVDA, AMZN, GOOGL, SMH and QQQ. I'm not trying to catch the exact bottom. I'd rather add gradually than assume today's price is the best one I'll see (my GOOGL thinking is in the Alphabet post).
For QQQ specifically, I think $660 would be a great point to add more. It's roughly the low QQQ hit on July 29 ($661), and about 13% below the October record. Here are the levels, measured from the record close of $759.66:
| Decline from record | QQQ level (approx.) | Note |
|---|---|---|
| -10% | $683.69 | Roughly where QQQ's intraday low landed in this pullback |
| -13% | ~$660 | My add-more level; near the July 29 low |
| -15% | $645.71 | Deeper correction territory |
These are levels I'm watching, not predictions. QQQ may bounce from here and never touch $660. Anything I add stays inside my rules: no single stock or asset above 10% of my portfolio, and smaller caps for riskier names (see my diversification and sizing post).
What Would Change My Mind?
- Revenue or profits at the big cloud and AI companies actually shrinking.
- Cloud growth rolling over while capex keeps climbing.
- Credit stress, or rising yields as AI companies borrow heavily.
- A decline that keeps going well past 20% with earnings falling alongside it.
Plan your buys before the next dip.
Dips like this are easier to handle with levels decided in advance. Set a free alert and get notified when Bitcoin dips, and try the DCA calculator for steady buying.
Create a free dip alert →Found this useful? Share it.
Disclosure: not financial advice
This article is my personal opinion, for educational purposes only. It is not financial, investment, legal, or tax advice and not a recommendation to buy, sell, or hold any security. Statements about what I'm doing describe my own situation and are not instructions. I may hold or trade the securities mentioned. Market data comes from third-party sources and may be incomplete or delayed, and the market may fall further. Investments can lose value, and past performance doesn't guarantee future results. Do your own research and consider speaking with a licensed financial advisor.
FAQ
Is this financial advice?
No. It's my personal opinion and what I'm doing myself, for education only. It says nothing about what's right for your portfolio.
Why did the Nasdaq fall in late October 2026?
Fear about AI spending. Alphabet lost about $500 billion in value on October 29, its biggest one-day dollar loss ever, after reporting negative free cash flow and heavy capex. On October 30, Intel fell about 29% on weak guidance, Amazon reiterated roughly $220 billion of 2026 capex and said spending would rise in 2027, and chip stocks dropped about 7%. Tech lost more than $1 trillion in value that day.
Is this a stock market crash or a correction?
So far it's a pullback. QQQ closed on October 30 about 9% below its October 6 record and touched roughly 10% down intraday. A correction is usually defined as a 10% decline from a high; a crash is far deeper and faster. It could still get worse.
How often does QQQ fall 10% or more?
Often. Since mid-2023 QQQ has had five completed declines of 10% or more (about 11% to 23%), and a sixth is in progress. Since 1999 it has had 19. Despite the pullbacks, QQQ is up about 97% over the last three years.
Is this a cyclical or a structural decline?
In my opinion it's cyclical: earnings at the big AI companies are still growing, and the fear is about the cost and payback of AI spending, which has hit tech before. It would look structural if hyperscaler revenue and profits started shrinking, cloud growth rolled over, or credit stress spread. Nobody knows for sure.
Why did ServiceNow (NOW) stock fall?
ServiceNow fell about 27% on October 29, 2026, its worst day on record, after its Q3 report: adjusted EPS of $1.00 missed the $1.02 estimate (its first miss in six quarters), contract-growth guidance slowed, and fears that AI could disrupt software resurfaced. Revenue still grew 20.5% to about $4.11 billion. The stock had run about 44% in the prior three months, so in my view part of the drop is a time correction.
Where would I add more QQQ?
Around $660, which is close to the July 29 low ($661) and about 13% below the October record. It's my personal level, not a prediction, and QQQ may never trade there.